
The effect of emission lines on the performance of photometric redshift estimation algorithms
A brief summary of the scientific motivation, modelling strategy, and the main conclusions of this first-author paper.
Key result: Emission lines do not simply add random noise to galaxy colours. Because they introduce structured, redshift-dependent colour trends, they can improve photometric-redshift performance and partly mitigate the impact of photometric uncertainties, especially at low redshift.
Motivation
While measuring redshifts of galaxies is a relatively simple process through spectroscopy, it becomes prohibitively expensive for large samples of fainter and farther away galaxies. Using instead photometric redshifts provides an alternative, but at the cost of reducing the redshift precision significantly. To improve this, we must better understand how subtle changes in the spectral features, such as changes in emission line strengths, affect photometric redshifts.
In galaxy spectroscopy, connecting nebular emission lines to the underlying stellar continuum in a realistic theoretical framework is challenging. A fully self-consistent treatment has to account for multiple stellar populations, the distribution and physical state of the interstellar medium, dust reddening, and the geometry of the galaxy itself. In practice, this introduces a large number of free parameters and makes accurate modelling difficult.
This motivated a more empirical approach. Rather than predicting emission-line behaviour from first principles, the goal of this project was to capture the observed variation directly from data. The central idea is that emission-line properties are not entirely random: they are weakly linked to the stellar populations and to the dominant excitation source of the gas, such as star formation or AGN activity. This weak correlation is what we aimed to describe using principal-component analysis and clustering techniques.
Method
Once the relation between continuum properties and emission-line behaviour had been characterised, the next step was to construct a spectral emulator capable of reproducing the distributions seen in SDSS. This made it possible to build realistic mock galaxy spectral catalogues in which the effects of photometric errors and emission lines could be switched on and off in a controlled way.
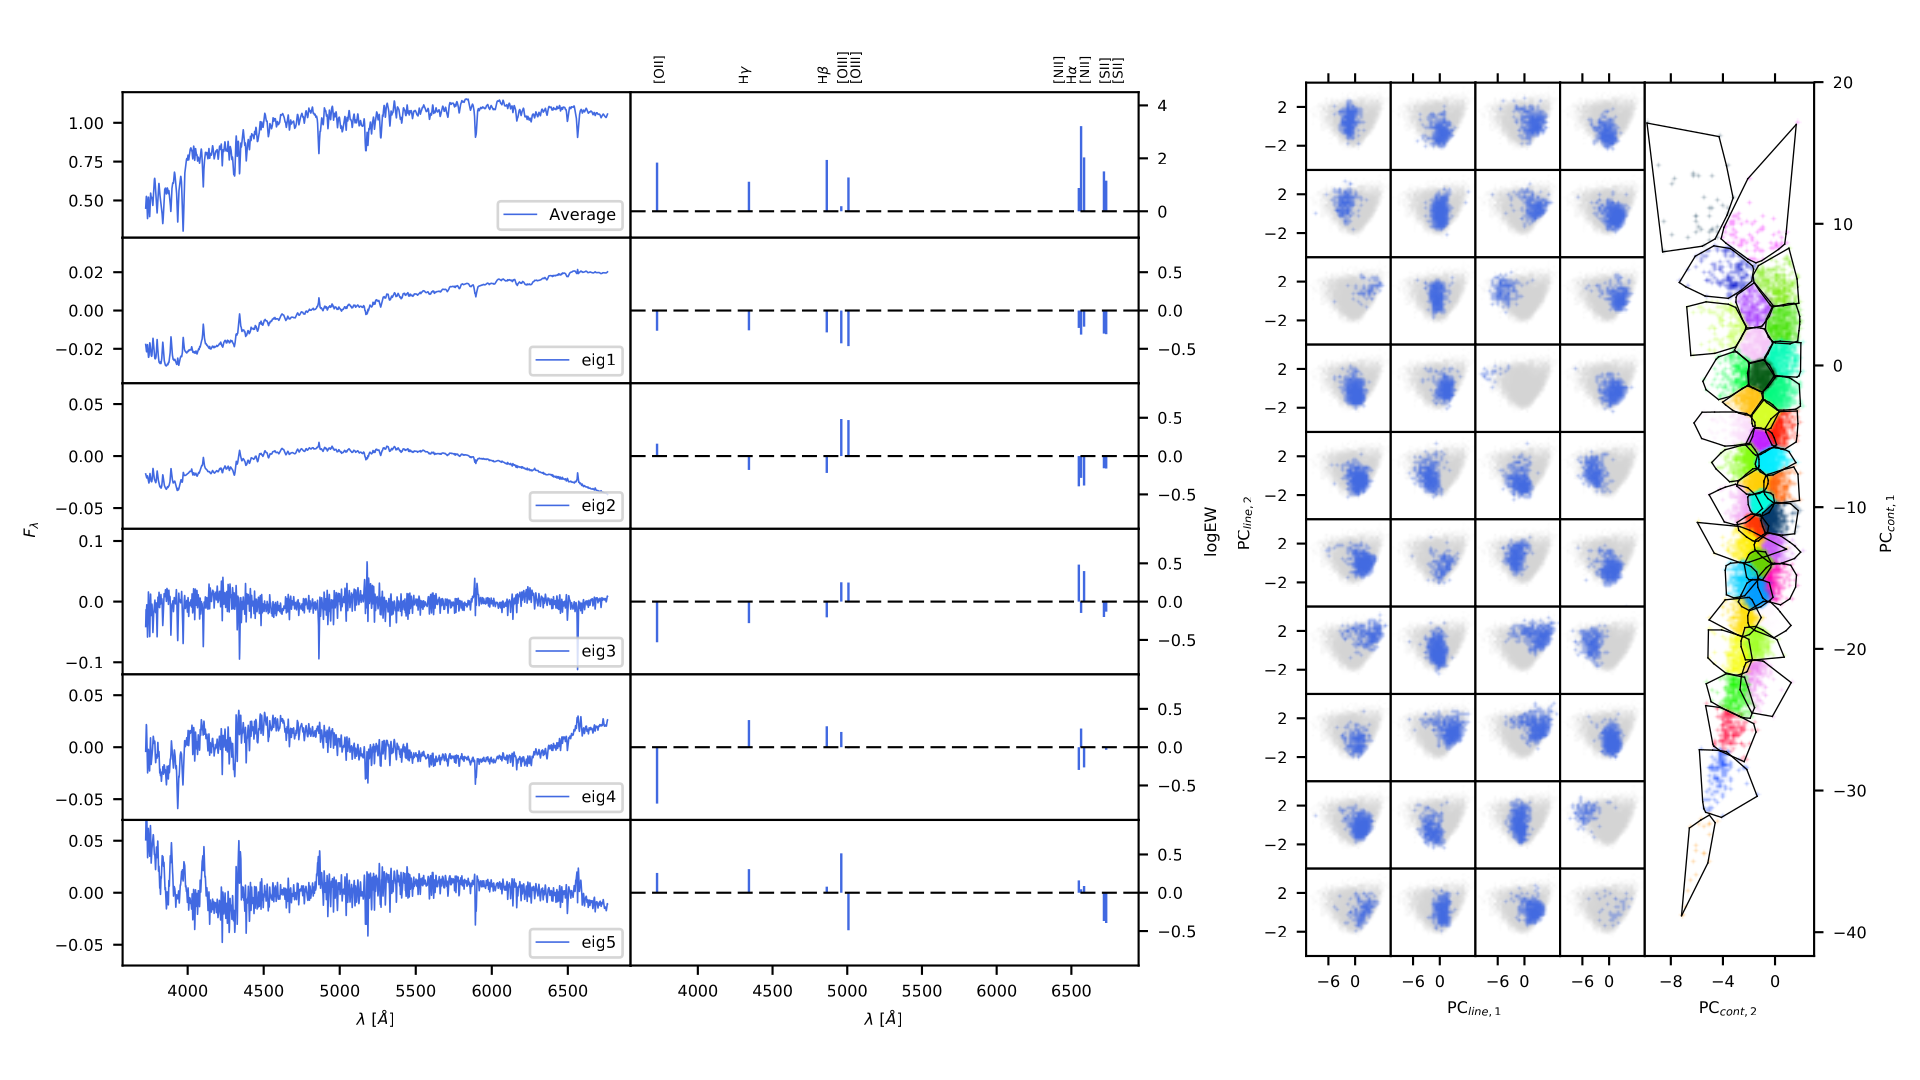
Figure 1. Principal-component analysis and clustering were used to connect the continuum properties of galaxies to realistic families of emission-line behaviour.
Main result
We found that emission lines induce additional trends in galaxy colours. These trends are not arbitrary, even though emission-line strengths vary substantially from object to object. Because emission lines are sharp spectral features that move through different photometric bands with redshift, they can alter observed colours significantly relative to the continuum-only case.
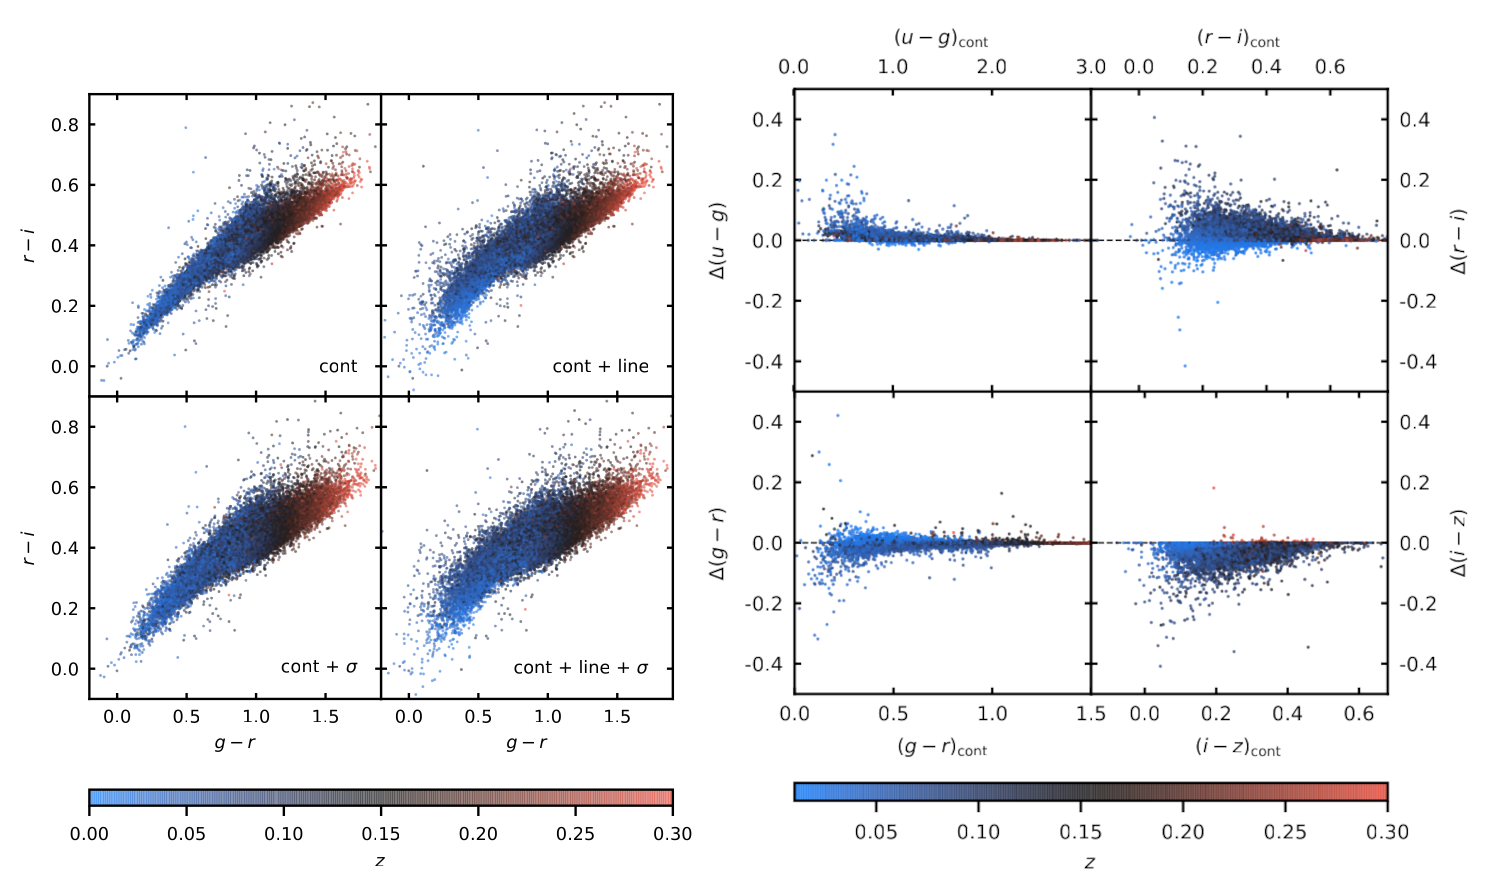
Figure 2. Emission lines introduce structured, redshift-dependent trends in colour space, rather than merely broadening the distribution at random.
Perhaps the most interesting outcome is that these sharp spectral features can actually help photometric-redshift estimation. The gain is not dramatic, because emission-line strengths themselves show considerable variation, but the effect is clearly beneficial rather than harmful. In particular, emission lines can reduce the impact of photometric noise, especially in the low-redshift regime, where estimators can perform nearly as well as in the idealised case without measurement uncertainties.
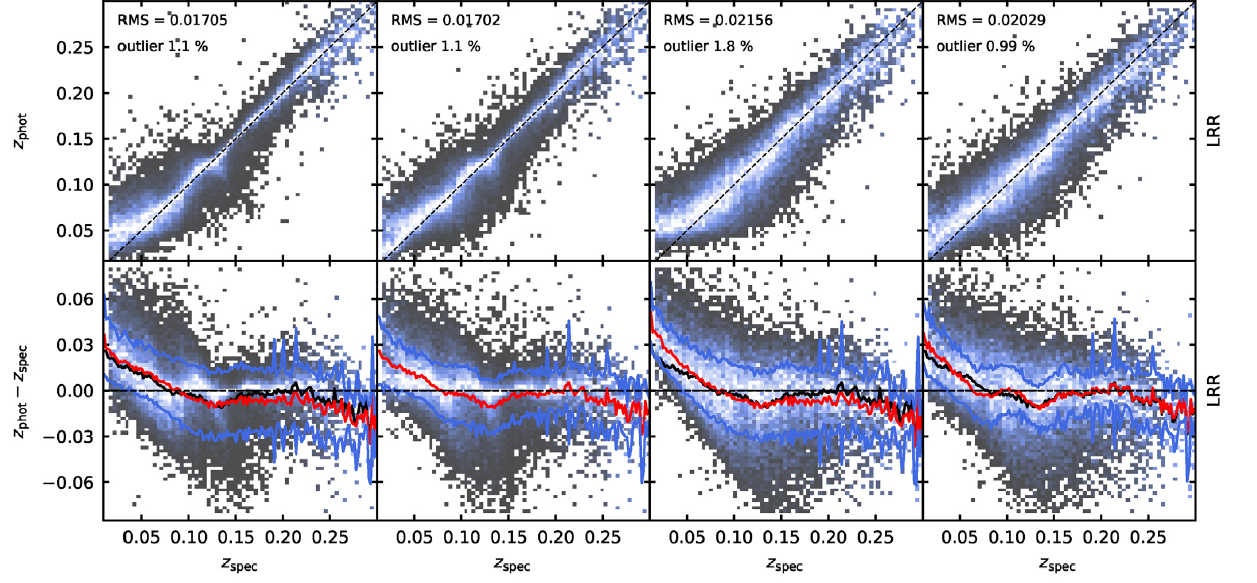
Figure 3. Visual summary of how realistic emission-line modelling affects galaxy colours and, in turn, the performance of photometric-redshift estimators. The first column shows the continuum only case, the second the one with added emission lines, and the last two rows show the same cases with added photometric errors.