
Study of changes in the pulsation period of 148 Galactic Cepheid variables
A brief summary of the scientific motivation, analysis, and main conclusions of this first-author paper.
Key result: Period fluctuations are common among Galactic Cepheids and become especially prominent at long periods. In this sample of 148 stars, nearly 40% show clear departures from smooth evolutionary period change, indicating that Cepheid periods are not perfectly stable even on top of their secular evolution.
Motivation
Cepheid variables are among the most intensively studied stars in astrophysics because their pulsation periods are tightly correlated with their luminosities. This makes them fundamental distance indicators and one of the cornerstones of the cosmic distance ladder. At the same time, that usefulness depends on how well their pulsation properties are understood. A natural question, then, is how stable their pulsation periods really are.
It has long been known that Cepheids evolve and that the Cepheid phase itself is only a relatively brief stage in stellar evolution. As the physical structure of a Cepheid changes, its pulsation period changes as well. Measuring those period changes therefore offers a powerful way to constrain the evolutionary stage and physical state of these stars. This paper set out to examine such behaviour for a large Galactic sample and to test how well smooth evolutionary change alone can explain the observations.
Method
Detecting period changes in Cepheids requires long observational baselines, since evolutionary effects build up slowly over decades. The standard tool for this is the classical O–C diagram, which compares observed timings to the timings predicted from a constant-period ephemeris. This formalism is sensitive to gradual drifts as well as to more complex departures from regular behaviour.
For this study, we compiled as much public photometric material as possible and constructed O–C diagrams for 148 Galactic Cepheids. In several cases, the time coverage extends back to before 1900, making it possible to trace their period evolution over more than a century.
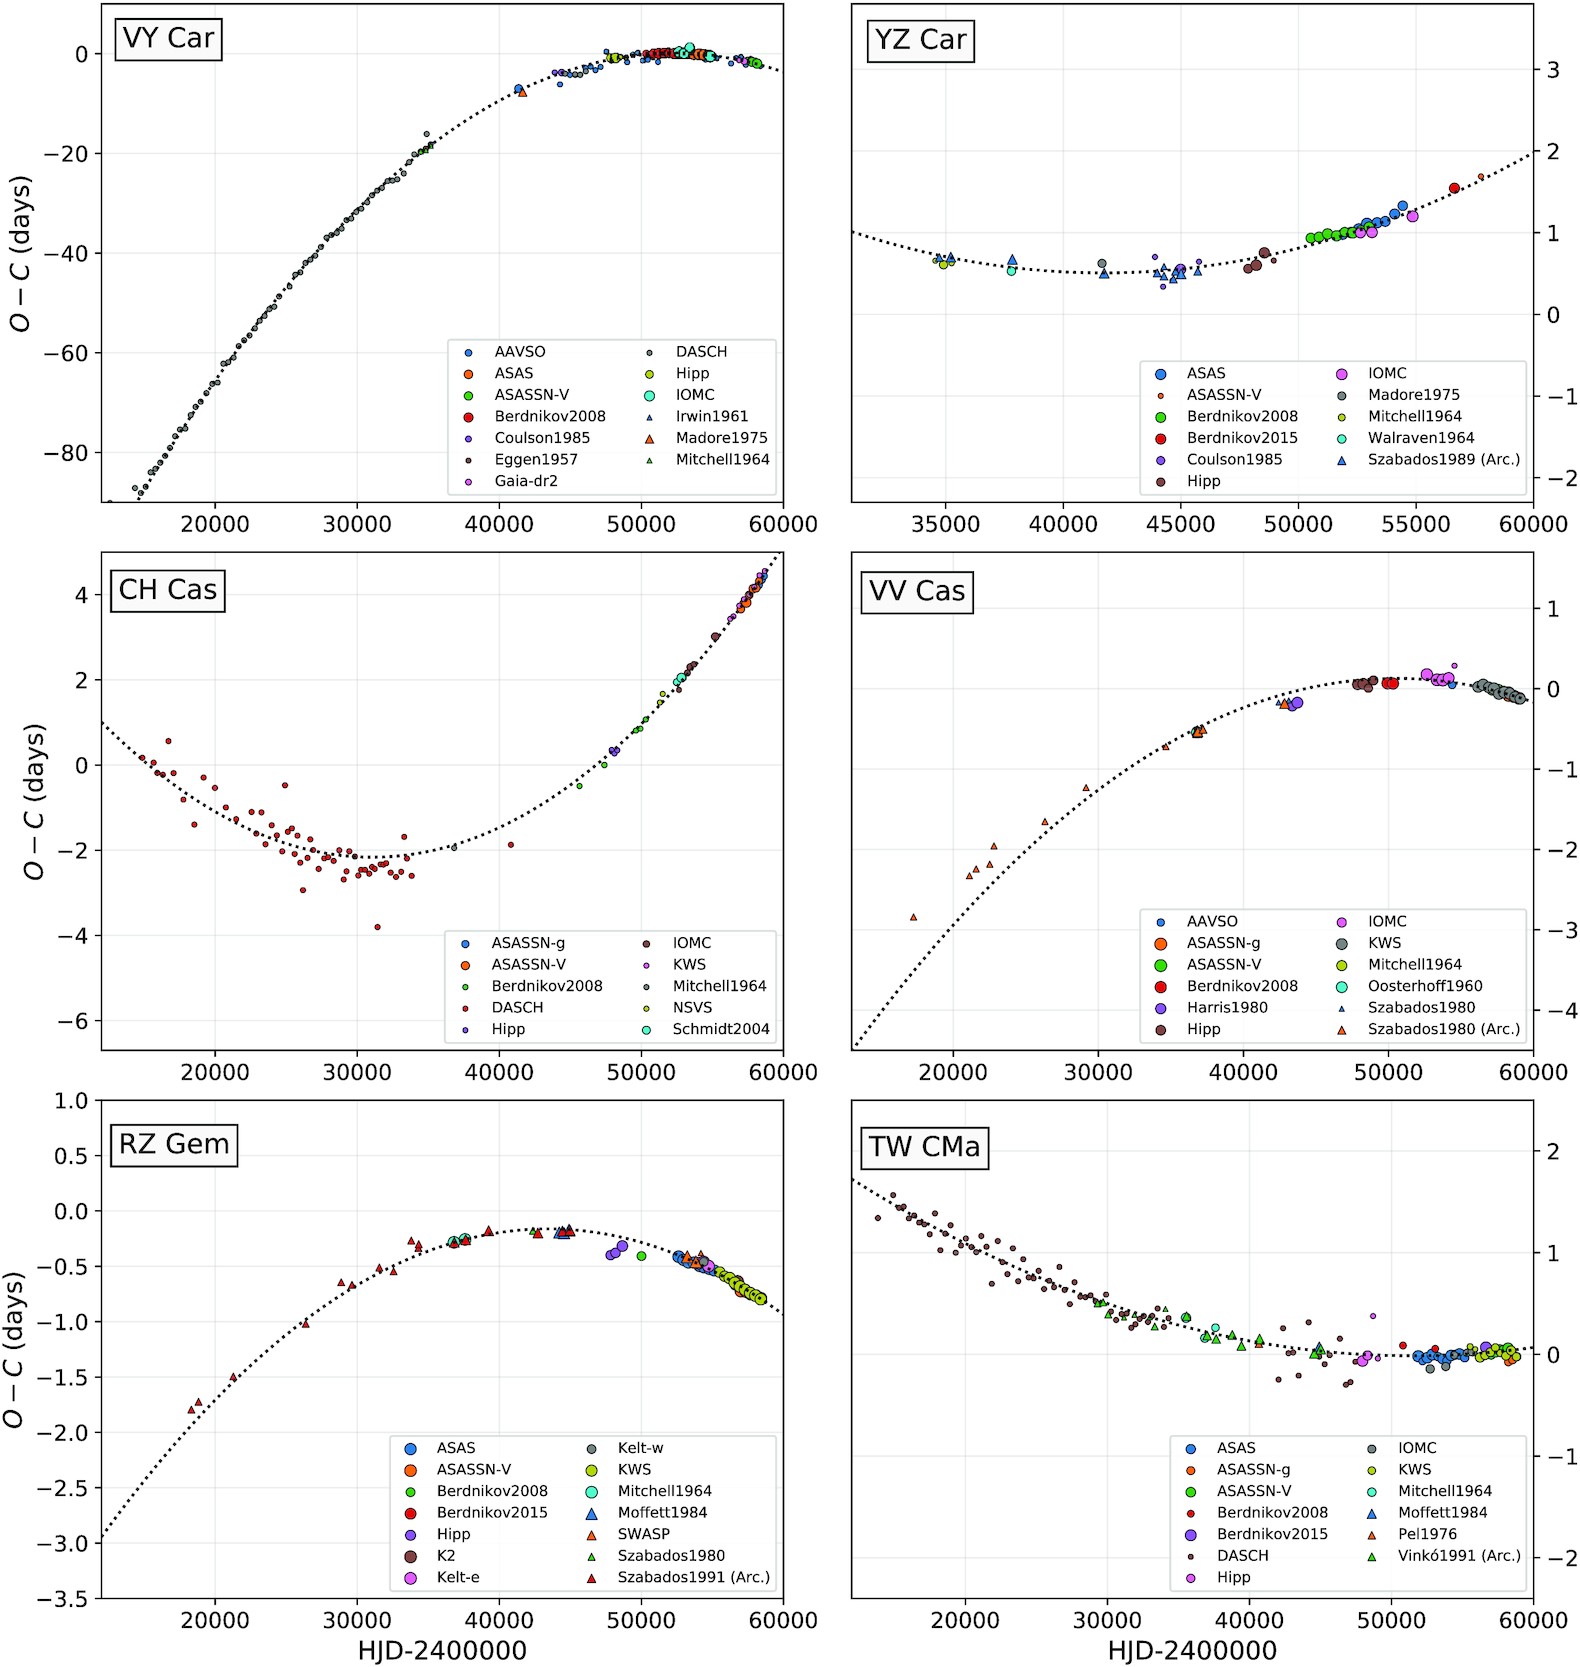
Figure 1. Example O–C diagrams for Cepheids monitored over the last century. Combining archival and modern datasets makes it possible to trace gradual period evolution on very long timescales.
Main result
Many of the resulting O–C diagrams show the smooth, gradual trends expected from stellar evolution. However, a large fraction display an additional quasi-periodic wave superimposed on that secular signal. While binary light-time effects can also produce wavelike signatures, the amplitudes observed in many cases are too large to be explained that way. The most natural interpretation is that the pulsation period itself is fluctuating.
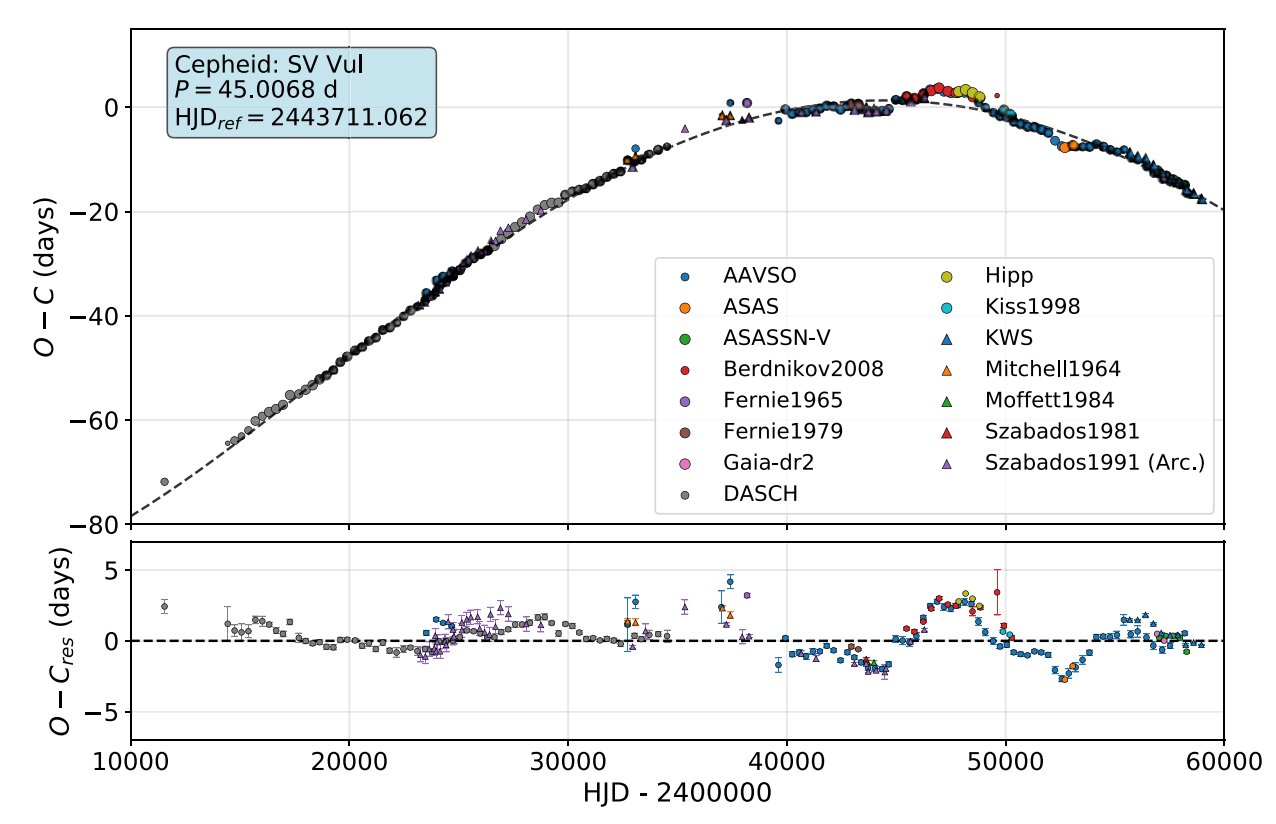
Figure 2. The O–C diagram of SV Vul illustrates strong period fluctuations. The upper panel shows the full signal, while the lower panel shows the residuals after subtracting the smooth evolutionary trend.
Extending the analysis to the full sample revealed that such fluctuations are not rare: nearly 40% of the 148 Cepheids show them. The trend becomes even more striking at long periods, where all objects in the sample exhibit fluctuation signatures. We also found that the strength of the fluctuations increases with period, suggesting that the phenomenon is linked to the stellar properties that also control long-period pulsation.
These results have several implications. They emphasise the importance of long-term photometric monitoring if one wants to measure Cepheid periods and evolutionary states reliably. They also imply a practical upper limit on how precisely period-change measurements can be interpreted, since part of the observed behaviour is not purely secular. Finally, the period dependence of the fluctuation signal offers a new way to probe the internal physics and evolutionary state of Cepheids.
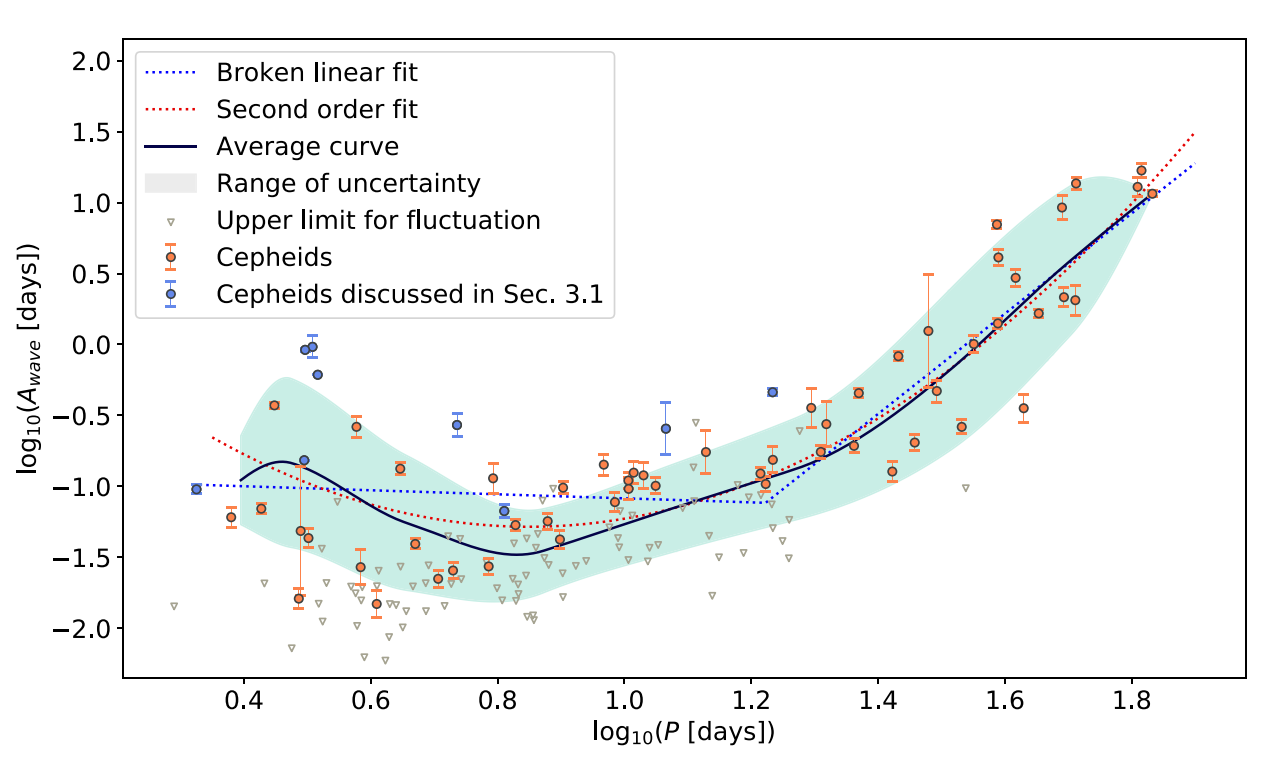
Figure 3. Fluctuation strength as a function of pulsation period. Long-period Cepheids consistently show fluctuation signatures, while shorter-period stars display a more mixed picture.